

The transformative power of nature: A new business member profile
Research has long shown that time spent in nature is good for us, body and soul. The American Heart Association, among...


These may be the longest days of summer, but you’ll definitely want to know current wave and water temperature conditions before you jump in for a swim or head out in your kayaak. Due to a relatively cool spring, the largest freshwater lake in the world is about 5 degrees behind normal averages in warming at the surface. The difference between an invigorating swim and potentially life-threatening hypothermia is literally a matter of degrees and timing. And our Wave Watch buoys verify just how quickly conditions can change.
Lake Superior’s deep-water temperture is 39 degrees year-round but at the surface, it’s a different story. As the graph from the Great Lakes Environmental Research Laboratory (GLERL) shows, surface water temperatures typically average in the upper 40s across the entire lake in late June and peak near 65 degrees in late August and early September.

Graph of surface water average temperatures for 2020 through 2025. The short orange line is 2025 to date – GLERL image
The lake is certainly not that warm yet. Water temperature modeling from the Great Lakes Environmental Research Laboratory indicates surface temperatures are generally now in the mid to upper 50s around the Apostle Islands National Lakeshore. However, local conditions can vary dramatically from this model-driven data, due to wave and weather conditions.

Surface water temperature modeling for June 28, 2005 – GLERL image

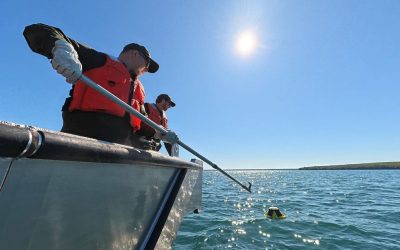
A Wave Watch buoy in position to report real-time data – Jon Okerstrom photo
Fortunately, the Wave Watch network of solar-powered buoys delivers something models can’t provide: real-time water temperature and wave reports for five key locations around the Apostle Islands National Lakeshore.
The buoys report data 24 hours a day, seven days a week through the Labor Day weekend. You can use this information to choose appropriate wetsuits for kayaking and where the warmest swimming locations might be.
For eample, take a look at how quickly surface water temperature can change at the mainland sea caves. The graph represents the month of June, to date. Our Wave Watch buoy measured a peak temperature of around 70 degrees briefly on June 18th and a quick decline to the lower 40s just a few days later.

The following graph explains the dramatic temperature drop. The Wave Watch buoy measured a big spike in wave height when the surface temperture fell. Those big waves mixed the warm surface water with cooler water below. Wind direction also plays a role as the waves and currents bounce off of the sandstone cliffs, which can cause upwelling of colder water to the surface.

60+ degree water may sound relatively warm, but water safety experts caution that hypothermia is a real risk for anyone in the water for too long. That’s why paddlers and others are advised to dress for the water temperature and not for the air temperature. Wearing wetsuits, even on the hottest days of the year, is often the smart choice when it comes to safety. It’s also really important to practice and know you can self-rescue if you capsize, or paddle with guides who can help you.
Our Wave Watch buoys also track water temperature changes off of Stockton Island. You’ll notice how different the temperature pattern is compared to the mainland sea caves during the month of June.

Surface water temperature readings may also be useful for people fishing an area called “the flats” between Long Island and Madeline Island. As the graph shows, the water there tended to be a little warmer than the water off of Stockton Island during the month of June.

Wave Watch is a collaborative effort by Friends of the Apostle Islands National Lakeshore, the University of Wisconsin – Madison and the National Park Service. You can track historical data for each of the buoy locations by clicking on the Historical Data buttons on our real-time data page. The historical data and real-time reports, are designed to help you make more informed safety decisions before and during your next adventure. Learn more about the 2025 Wave Watch deployment and the buoy locations here. We hope you find Wave Watch to be a valuable service and will join our current Wave Watch sponsors and individual donors with your support. Enjoy the summer and be safe out there!


Written by Jon Okerstrom, a Friends of the Apostle Islands National Lakeshore board member and digital and social media volunteer with a background in digital and television journalism, photography and graphic design.
Share this article…
Research has long shown that time spent in nature is good for us, body and soul. The American Heart Association, among...

Bands of elk are not the only ones to gather in Estes Park, Colorado this autumn. The gateway city to Rocky Mountains...
We saw it in the first hints of crimson and gold in the mainland treeline. We felt it when the water temperature...